Calculating Scope 3 emissions: How to proceed methodically and correctly
Corporate Sustainability


Companies calculate Scope 3 emissions along their entire value chain according to the Greenhouse Gas Protocol—with spend-based, activity-based, or supplier-specific methods. Scope 3 accounts for 70 to 90 percent of total emissions in many industries and is also the most demanding area from an accounting perspective. This guide shows step by step which of the 15 Scope 3 categories are relevant for your company, which calculation method fits when, which emission factors you need, and how to meet the requirements of CSRD and ESRS E1.
What are Scope 3 emissions?
Scope 3 emissions are all indirect greenhouse gas emissions that arise along a company's value chain without being caused by its own facilities or its own energy purchases. They include both upstream activities such as the purchase of raw materials, supplier logistics, or business travel and downstream activities such as the use of sold products and their disposal. Scope 3 emissions are defined in the Corporate Value Chain (Scope 3) Accounting and Reporting Standard of the Greenhouse Gas Protocol, the globally established accounting standard for greenhouse gas emissions.
In many manufacturing industries, 70 to 90 percent of total emissions are attributable to Scope 3. This makes this accounting area the biggest lever for effective decarbonization. There are three main methodological approaches for calculation (spend-based, activity-based, supplier-specific), which can be combined by category depending on data availability.
Distinction from Scope 1 and Scope 2
The three scopes of the Greenhouse Gas Protocol clearly separate emission sources from one another. This separation forms the methodological basis of every corporate greenhouse gas inventory and is a prerequisite for consistent reporting.
Scope 1 includes all direct emissions from sources that the company controls itself. These include emissions from its own heating systems, production machinery, backup generators, and company-owned fleet vehicles.
Scope 2 includes all indirect emissions from purchased energy that the company consumes—typically electricity, district heating, district cooling, and steam. The emissions physically occur at the energy supplier, but are allocated to the consumer.
Scope 3 includes all other indirect emissions along the value chain that are not included in Scope 1 or 2. You can find a detailed methodological classification of Scope 1 and Scope 2 in the separate guide.
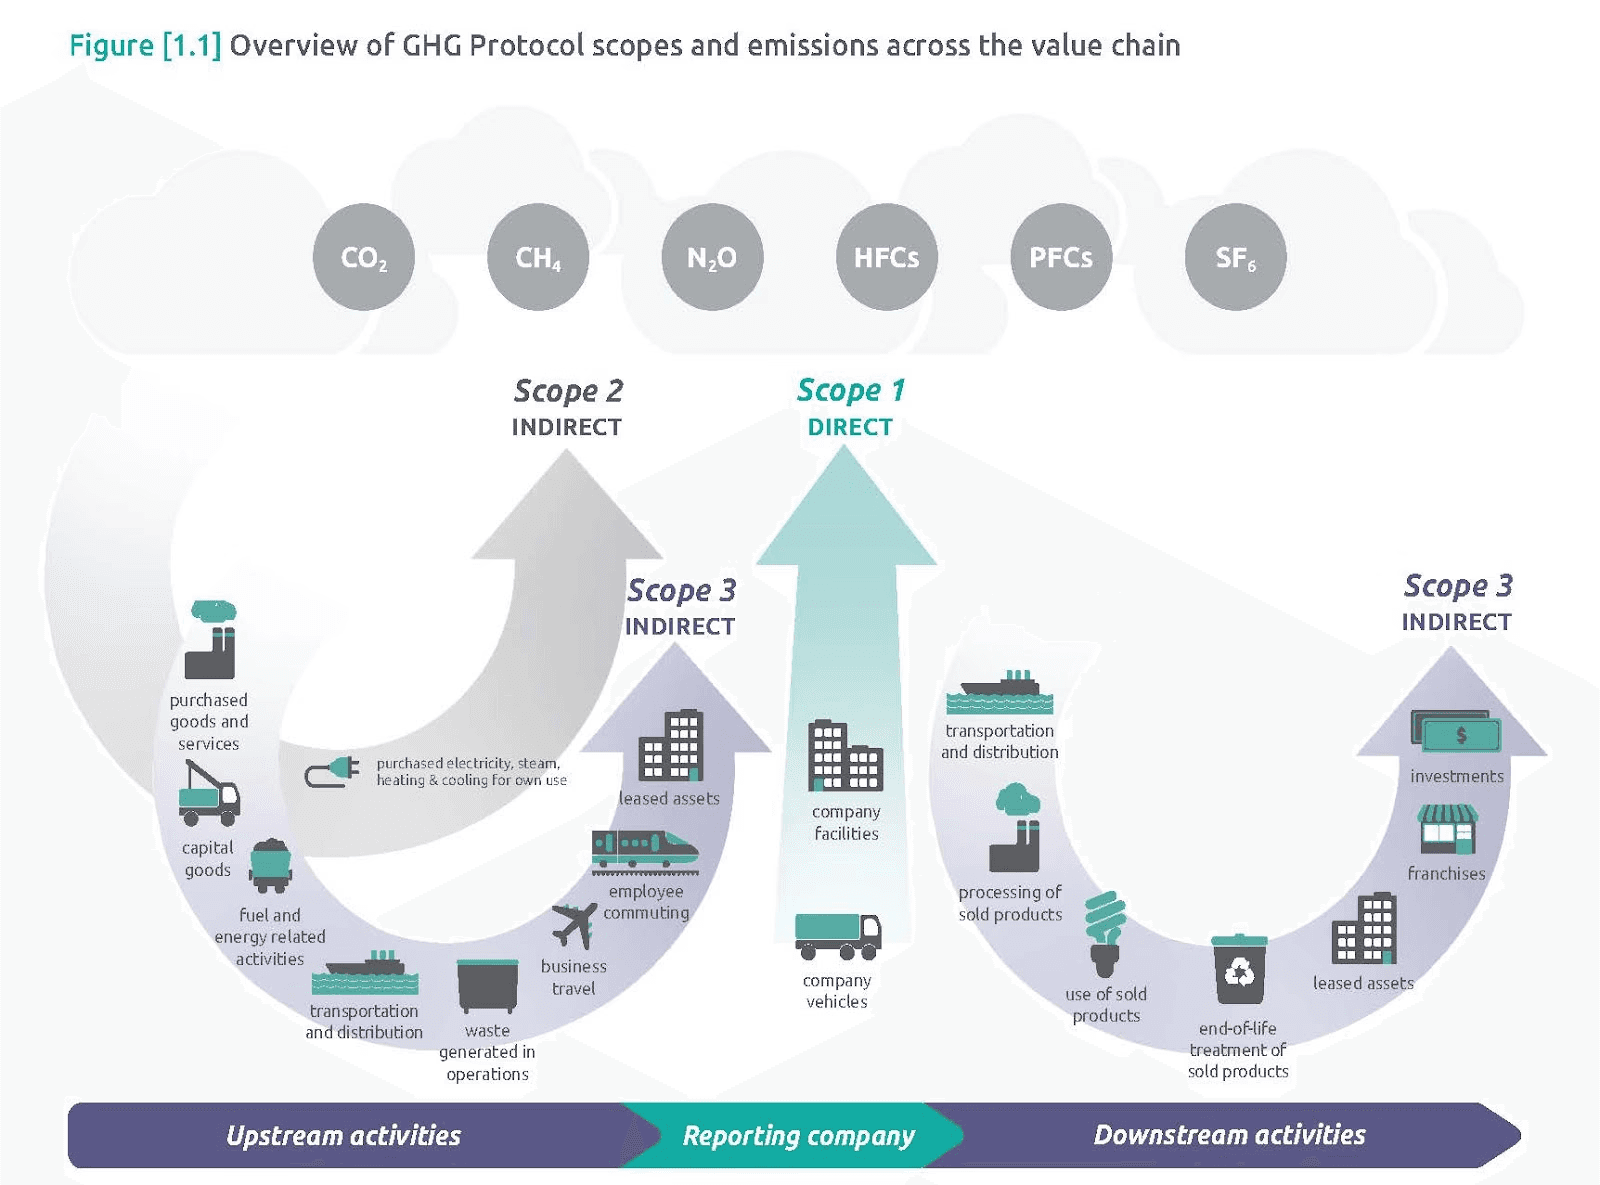
Source: GHG Protocol
What Scope 3 categories are there according to the GHG Protocol?
The Greenhouse Gas Protocol divides Scope 3 emissions into 15 clearly defined emissions categories. Eight of them are upstream and occur before the company boundary; seven are downstream and occur after the products are sold. Which categories are relevant for a company depends on the industry, business model, and depth of the value chain. The following table provides a complete overview.
Type | No. | Category | Description | Practical example |
|---|---|---|---|---|
Upstream | 1 | Purchased goods and services | Emissions from the production and upstream chain of purchased goods and services | Steel, plastics, IT services |
Upstream | 2 | Capital goods | Emissions from investment goods such as machinery, buildings, IT hardware | Production plant, office building |
Upstream | 3 | Fuel- and energy-related activities | Upstream emissions from purchased energy and fuels | Extraction, refinery, electricity generation |
Upstream | 4 | Upstream transportation and distribution | Logistics emissions for incoming deliveries before the company boundary | Delivery of raw materials by truck or ship |
Upstream | 5 | Waste generated in operations | Emissions from the disposal and treatment of operational waste | Residual waste, production waste, wastewater |
Upstream | 6 | Business travel | Emissions from business trips by plane, train, car, or rental car | Flights to customers, hotel stays |
Upstream | 7 | Employee commuting | Emissions from employees' commutes to work | Use of cars, public transport, and bicycles |
Upstream | 8 | Upstream leased assets | Emissions from leased assets, if not included in Scope 1/2 | Leased warehouse space, machinery |
Downstream | 9 | Downstream transportation and distribution | Logistics emissions for deliveries after sale | Delivery to wholesalers and end customers |
Downstream | 10 | Processing of sold products | Emissions from further processing of sold intermediate products | Semi-finished products, components |
Downstream | 11 | Use of sold products | Emissions during the use phase at the end customer | Energy consumption of machinery, electrical appliances, vehicles |
Downstream | 12 | End-of-life treatment of sold products | Emissions from recycling, incineration, or landfill | Packaging disposal, product recycling |
Downstream | 13 | Downstream leased assets | Emissions from leased assets used by third parties | Rented machinery, real estate |
Downstream | 14 | Franchises | Emissions from the company's franchise operations | Franchisees in retail |
Downstream | 15 | Investments | Emissions from equity stakes, loans, and fund investments | Financial investments, project financing |
Not all 15 categories are material for every company. The GHG Protocol requires a structured materiality analysis that takes into account volume, data availability, reduction potential, and stakeholder expectations. For most industrial companies, five categories are larger in volume than all others: Category 1 (Purchased goods and services), Category 3 (Fuel- and energy-related activities), Category 4 (Upstream transportation), Category 6 (Business travel), and Category 11 (Use of sold products).
What methods are available for calculating Scope 3 emissions?
Three main methodological approaches have become established for calculating Scope 3 emissions: the spend-based, activity-based, and supplier-specific methods. They differ in data basis, accuracy, and effort and are often combined in practice. Which method fits each category depends on data availability.
Spend-based method
The spend-based method calculates emissions based on monetary spending on purchased goods or services, multiplied by industry-specific emission factors in kg CO₂e per euro. It is the pragmatic entry point when no quantity-based data are available. The data basis is ERP or accounting data, which are already available in most companies.
Formula:
Emissions (kg CO₂e) = Spending (€) × Emission factor (kg CO₂e/€)Example:
A company purchases steel worth €50,000.
Steel emission factor (spend-based): 2.5 kg CO₂e/€
→ 50,000 × 2.5 = 125,000 kg CO₂e = 125 t CO₂e
Advantage: a fast, broadly applicable initial inventory for all 15 categories. Disadvantage: relatively inaccurate because it depends on price (inflation and supplier prices distort the result) and is not supplier-specific. Suitable for an initial assessment or categories with low materiality.
Activity-based method
The activity-based method multiplies a specific activity amount (tons, kilometers, kilowatt-hours) by an activity-based emission factor. It is much more accurate than the spend-based approach because it maps real quantities rather than monetary values. Data sources are internal systems such as logistics software, energy management, or HR systems.
Formula:
Emissions (kg CO₂e) = Activity amount (t, km, kWh) × Emission factor (kg CO₂e/unit)Example (Category 4 – Upstream transportation):
10 t of goods are transported 500 km by truck.
Truck emission factor: 0.12 kg CO₂e/(t·km)
→ 10 × 500 × 0.12 = 600 kg CO₂e = 0.6 t CO₂e
Advantage: quantity-based reality, well suited for audits. Disadvantage: requires reliable activity data. Particularly suitable for Category 4 (transport), Category 6 (business travel), and Category 7 (commuting).
Supplier-specific method
The supplier-specific method uses direct emissions data from suppliers, typically in the form of a Product Carbon Footprint (PCF) per unit. It delivers the highest accuracy because it reflects the actual emission intensity of the specific supplier instead of using industry averages. The prerequisite is that suppliers provide verified PCF data.
Formula:
Emissions (kg CO₂e) = Purchased quantity (kg/units) × PCF value (kg CO₂e/kg or unit)Example (Category 1 – Aluminum):
A supplier delivers 100 t of aluminum with a PCF of 8.5 kg CO₂e/kg.
→ 100,000 × 8.5 = 850,000 kg CO₂e = 850 t CO₂e
Advantage: highest accuracy, supplier-specific and audit-ready. Disadvantage: data collection is time-consuming and requires PCF-capable suppliers. Particularly suitable for the highest-volume suppliers in Category 1 once PCF data are available.
Comparison of the three methods
Method | Accuracy | Effort | Best use |
|---|---|---|---|
Spend-based | Low to medium | Low | Initial inventory, estimate for all 15 categories |
Activity-based | Medium to high | Medium | Transport, business travel, commuting, energy |
Supplier-specific | High | High | Key suppliers in Category 1, once PCFs are available |
In practice, most companies combine all three methods: spend-based for immaterial categories, activity-based for high-volume operational categories, and supplier-specific for the strategically most important suppliers.
How do I calculate Scope 3 emissions for the most important categories?
The following calculation examples show the practical application of the methods for the five highest-volume Scope 3 categories. All examples are sized to reflect typical DACH companies and to represent realistic magnitudes.
Category 1: Purchased goods and services
Category 1 is often the highest-volume Scope 3 category in manufacturing companies and often accounts for 50 to 80 percent of the total Scope 3 inventory. All three calculation methods are applicable; the following example shows a direct comparison for the same purchase by a furniture manufacturer that sources 200 tons of wood for €80,000.
Spend-based:
€80,000 × 0.45 kg CO₂e/€ = 36,000 kg CO₂e = 36 t CO₂eActivity-based:
200,000 kg × 0.30 kg CO₂e/kg = 60,000 kg CO₂e = 60 t CO₂eSupplier-specific (supplier PCF):
200,000 kg × 0.22 kg CO₂e/kg = 44,000 kg CO₂e = 44 t CO₂e
The spread between the three results (36 to 60 t CO₂e) shows how strongly the choice of method can influence the accounting result. For the highest-volume suppliers, it is therefore worth the effort to calculate supplier-specific values.
Category 4: Upstream transportation and distribution
Category 4 captures all logistics emissions generated for delivering goods and materials to the company. The relevant factors are the mode of transport, transported tonnage, and distance traveled. The choice of transport mode has a major leverage effect on emissions, as the following example for delivering components from Asia shows.
Ocean freight example:
50 t of components × 18,000 km × 0.016 kg CO₂e/(t·km)
= 14,400 kg CO₂e = 14.4 t CO₂eAir freight comparison:
50 t of components × 18,000 km × 0.602 kg CO₂e/(t·km)
= 541,800 kg CO₂e = 541.8 t CO₂e
→ Air freight emits about 38 times as much as ocean freight.
Activity-based data for Category 4 are usually available from the logistics service provider and should be systematically requested there. Pure spend-based calculations lead to significant distortions in logistics.
Category 6: Business travel
Business travel generates emissions through flights, train journeys, rental cars, and hotel stays. Calculation is typically activity-based, with distances in passenger kilometers multiplied by emission factors that depend on transport mode and class. The DEFRA database of the UK government provides detailed factors by flight class (economy, business, first) and distance class (short-, medium-, long-haul).
Example: consulting company with 10 employees
Per person, 4 long-haul flights Frankfurt–New York per yearRound-trip distance: 12,400 km
Economy class emission factor: 0.255 kg CO₂e/(pkm)
Per trip: 12,400 × 0.255 = 3,162 kg CO₂e
40 trips per year: 40 × 3,162 = 126,480 kg CO₂e
= 126.5 t CO₂e/year
A travel management platform or a centralized booking tool makes data collection much easier. If data are collected manually, distance, class, and number of trips should be documented without gaps.
Category 7: Employee commuting
Category 7 captures emissions from employees' daily commute to work. The data basis is an employee survey on mode of transport, one-way distance, and number of in-office days per week. Work-from-home days reduce attributable commuting emissions accordingly.
Example: 50 employees, avg. 25 km one-way commute
Mode split: 80% car, 20% public transport
Working days per year: 220Car share:
40 employees × 50 km × 220 days × 0.170 kg CO₂e/km = 74,800 kg CO₂ePublic transport share:
10 employees × 50 km × 220 days × 0.089 kg CO₂e/(pkm) = 9,790 kg CO₂eTotal: 84,590 kg CO₂e = 84.6 t CO₂e/year
For large workforces, the survey can be based on representative samples, provided the methodology is documented. ESRS E1 requires transparency about the chosen approach.
Category 11: Use of sold products
Category 11 is especially relevant for manufacturers of energy-consuming products such as industrial machinery, electrical appliances, or vehicles. Emissions arise throughout the entire use phase at the end customer. The calculation combines the number of units sold, average energy consumption per year, the electricity emission factor, and the expected useful life.
Example: machinery manufacturer sells 500 industrial pumps per year
Electricity consumption per pump: 8,000 kWh/year
Expected useful life: 15 years
Emission factor for the German electricity mix: 0.344 kg CO₂e/kWh
(UBA, as of 2025)Lifecycle emissions:
500 × 8,000 × 0.344 × 15 = 20,640,000 kg CO₂e
= 20,640 t CO₂e over the lifetimePer sales cohort: 1,376 t CO₂e/year
For Category 11, linking it with product development is especially worthwhile: more energy-efficient product designs directly affect the company's own carbon footprint and the Scope 3 emissions of customers.
Step-by-step guide: calculating Scope 3 emissions
The structured calculation of Scope 3 emissions follows seven successive steps. It takes you from defining the system boundaries through data collection to reporting and the derivation of reduction targets. Each step is a prerequisite for the next and should be documented carefully to ensure auditability.
Step 1: Define system boundaries and base year
First define the reporting scope: Which legal entities, sites, and subsidiaries are included? Choose a base year, typically the first fully captured fiscal year. Decide whether you use the operational control approach or the equity share approach under the GHG Protocol. These decisions form the methodological framework for all subsequent steps and must remain consistent over the years.
Step 2: Materiality analysis of Scope 3 categories
Identify which of the 15 GHG Protocol categories are material for your company. Assessment criteria are the estimated emissions volume, data availability, reduction potential, and the expectations of relevant stakeholders. The result is a prioritized list of the categories to be calculated. The materiality analysis for the carbon footprint is also subject to documentation requirements under ESRS E1.
Step 3: Select a calculation method for each category
The appropriate method depends on data availability. Spend-based if only financial data are available. Activity-based if quantity, distance, or energy data are available. Supplier-specific if validated PCF data from the supplier are available. The methods can be combined per category, so you can calculate supplier-specific values for your most important suppliers and spend-based values for lower-priority categories.
Step 4: Collect activity and spending data
Internal data sources include ERP systems, accounting, fleet management, energy management, and HR systems. External sources include supplier questionnaires, logistics partners, and utilities. Data gaps are bridged with secondary data or industry benchmarks and documented transparently. A consistent data structure makes plausibility checks and later auditing much easier.
Step 5: Research and assign emission factors
Select emission factors appropriate to the region, the process, and the chosen method. German sources include the Federal Environment Agency (UBA) and the ProBas database. DEFRA, EPA, and ecoinvent are internationally established. The source, reference year, and scope of use of each factor must be documented to make the calculation traceable.
Step 6: Calculate and consolidate emissions
Apply the selected formulas per category: activity data or spending multiplied by the emission factor gives emissions in kg CO₂e. Convert all results to tons of CO₂ equivalent and aggregate them into the total Scope 3 inventory. Watch out for double counting, for example between Category 1 and Category 4 if suppliers have already integrated their logistics emissions into the PCF.
Step 7: Evaluate, report, and set targets
Identify the emissions hotspots, i.e., the categories with the highest values. Document assumptions, methods, and data sources transparently for external reporting. Derive science-based reduction targets according to SBTi and integrate the results into your climate strategy. For CSRD reporting, disclose emissions in accordance with ESRS E1.
Which data sources and emission factors do I need?
Reliable emission factors are the foundation of any robust Scope 3 calculation. A distinction is generally made between primary data (values collected directly from suppliers, such as PCFs or energy consumption) and secondary data (industry averages from databases). Primary data are more accurate and should be sought for the highest-volume suppliers. Secondary data are an acceptable and in practice indispensable fallback, provided the associated data uncertainty is documented transparently.
Source | Type | Free? | Suitability |
|---|---|---|---|
Federal Environment Agency (UBA) | Secondary data | Yes | Emission factors for electricity, heat, and fuels for Germany |
ProBas (UBA) | Secondary data | Yes | Broad factor database for German industrial and energy processes |
DEFRA (UK) | Secondary data | Yes | Internationally used factors for flights, transport, energy |
EPA (USA) | Secondary data | Yes | US factors, often also usable for international reports |
ecoinvent | Secondary data | No (commercial) | Most detailed life cycle database, reference for PCF studies |
Sphera LCA for Experts (formerly GaBi) | Secondary data | No (commercial) | Industry-specific data, frequently used in industry |
Supplier PCFs | Primary data | Variable | Highest accuracy for Category 1 for key suppliers |
The choice of database should be documented consistently. For CSRD reporting, the sources used, reference years, and scopes of application must be disclosed in the sustainability report. If methods are mixed (spend-, activity-, supplier-specific side by side), documentation is required per category.
What do CSRD and the GHG Protocol require for Scope 3 reporting?
The Corporate Sustainability Reporting Directive (CSRD) requires affected companies to provide structured sustainability reporting under the European Sustainability Reporting Standards (ESRS). With the Omnibus I package from December 2025, the scope and thresholds were significantly adjusted, so the reporting obligation now applies to a more focused group of large companies.
Who must report Scope 3 under the CSRD?
Under the CSRD, companies with more than 1,000 employees and annual revenue above 450 million euros are required to report. The first reports are to be prepared for fiscal year 2027. Non-EU companies with EU revenue above 450 million euros fall under the reporting obligation from 2028. Companies below the thresholds can report voluntarily under the Voluntary Standard for SMEs (VSME), but they are often drawn into the reporting process indirectly through supplier requirements from their large customers.
What exactly does ESRS E1 require for Scope 3?
ESRS E1 is the climate standard within the ESRS and requires disclosure of all material Scope 3 categories, including the calculation methods and data assumptions used. Companies must explain which categories they classify as material and which they do not. The methodological basis may be the GHG Protocol, which ESRS E1 explicitly references as an allowed accounting standard. Key requirements are:
Materiality analysis for Scope 3 categories with documented justification
Quantitative disclosure of all material categories in tons of CO₂ equivalent
Method and data transparency including assumptions, sources, and estimation uncertainties
Reduction targets and transition plan with reference to science-based pathways
External assurance at limited assurance level under ISAE 3000 (Revised)
What other drivers are there for Scope 3 transparency?
Beyond the CSRD, there are other drivers that lead companies to Scope 3 accounting regardless of a direct reporting obligation. The Science Based Targets initiative (SBTi) requires a complete Scope 3 inventory for validated climate targets once Scope 3 accounts for more than 40 percent of total emissions. ESG ratings such as EcoVadis and CDP are increasingly weighting Scope 3 transparency more heavily. Large customers are integrating CO₂ data into supplier assessments and tender criteria. The EU Carbon Border Adjustment Mechanism (CBAM) requires emissions data for imported products from emissions-intensive sectors. The German Supply Chain Due Diligence Act (LkSG) lost its pure reporting obligation in 2025, but the substantive due diligence obligations continue to apply.
Which software tools are suitable for Scope 3 calculation?
Three software categories have become established for Scope 3 calculation: ERP-integrated modules, specialized carbon accounting platforms, and spreadsheet-based in-house solutions. ERP modules (for example as an add-on to SAP or Microsoft Dynamics) offer the advantage of data integration, but are often methodologically limited. Specialized platforms combine data integration with GHG Protocol compliance and typically provide integrated emission factor databases and supplier management. Spreadsheet-based in-house solutions are suitable for small inventories, but reach their limits in scaling and auditability.
Important selection criteria are compliance with the GHG Protocol, connection to ERP and procurement systems, supplier integration for PCF data, auditability of the calculation steps, and CSRD-compliant reporting output. For industrial companies with complex supply chains, matching purchasing items to emission factors is also the decisive lever for accuracy and efficiency.
Global Changer offers an AI-supported platform for calculating Scope 1 to 3 with direct connection to ERP and data warehouse systems. The AI matching for category 3.1 (Purchased goods and services) automatically assigns purchasing items to the appropriate emission factors from ecoinvent, EcoTransIT, and DEFRA. In addition, the PCF module enables the creation of supplier-specific product inventories for Category 1.
Frequently asked questions about Scope 3 calculation
How do I calculate Scope 3 emissions?
Scope 3 emissions are generally calculated using the formula: activity data × emission factor = emissions in kg CO₂e. Three main methods are available: spend-based (spending in euros × emission factor), activity-based (for example ton-kilometers × emission factor), and supplier-specific (purchased quantity × supplier's Product Carbon Footprint). In practice, companies combine the methods depending on data availability for each category. The governing standard is the Greenhouse Gas Protocol with the Corporate Value Chain Accounting and Reporting Standard.
Which method is the most accurate for Scope 3?
The supplier-specific method delivers the highest accuracy because it uses real emissions data from individual suppliers in the form of Product Carbon Footprints (PCFs). The activity-based method follows with a moderate level of accuracy and is particularly suitable for transport, energy, and commuting. The spend-based method is the least accurate because it relies on industry averages and depends on price, but it is fast and suitable for a pragmatic initial inventory.
What are the 15 categories under the GHG Protocol?
The GHG Protocol defines 15 Scope 3 categories, eight upstream and seven downstream. Upstream includes purchased goods, capital goods, fuel- and energy-related activities, upstream transport, waste, business travel, commuting, and upstream leased assets. Downstream includes downstream transport, processing and use of sold products, end-of-life treatment, downstream leased assets, franchises, and investments. Which categories are material depends on the industry and business model.
Is Scope 3 mandatory under the CSRD?
Yes, for CSRD-reporting companies, disclosure of material Scope 3 categories under ESRS E1 is mandatory. According to the Omnibus I package from December 2025, this applies to companies with more than 1,000 employees and annual revenue above 450 million euros, first for fiscal year 2027. ESRS E1 requires a documented materiality analysis, quantitative disclosure in CO₂ equivalents, and transparency regarding methods and data sources. The report must be externally assured at limited assurance level.
Which emission factors do I need for Scope 3?
Which emission factors are needed depends on the category and the chosen calculation method. For German energy and fuel data, the Federal Environment Agency (UBA) provides the key factors. For international transport and travel data, the DEFRA database of the UK government is established. For life cycle data and industry-specific processes, ecoinvent is often used, supplemented by Sphera or industry-specific databases. The sources used, reference years, and scopes of application must be documented for CSRD reporting.
How do I deal with missing supplier data?
If supplier data are missing, companies fall back on secondary data, i.e., industry averages from databases such as ecoinvent or DEFRA. A staged approach is recommended: first spend-based as an estimate, then targeted supplier surveys for the most material categories, and finally activity-based or supplier-specific data for the top emitters. Transparent documentation is important: data gaps, estimation assumptions, and data quality must be disclosed in the report to ensure auditability under ESRS E1.
How do I clearly separate Scope 3.1 and Scope 3.2?
Scope 3.1 (Purchased goods and services) covers consumables and ongoing services that are used or processed during the fiscal year, for example raw materials, packaging, or IT services. Scope 3.2 (Capital goods), by contrast, covers investment goods with multi-year useful lives that are recognized as fixed assets, such as machinery, buildings, or servers. The distinction follows accounting logic: OPEX items belong in 3.1, CAPEX items in 3.2. Capital goods are recorded in full in the year of purchase, not spread over their useful life.
How often do I need to calculate Scope 3 emissions?
Scope 3 emissions are usually calculated annually for the respective fiscal year. The CSRD requires annual reporting in the management report, and science-based climate targets under SBTi also require continuous updates. It is important to define a base year once as a benchmark for future reductions, typically the first fully captured fiscal year. Methodological adjustments, acquisitions, or disposals may require a recalculation of the base year, which must be documented in the report.